**EDA** is a versatile web-based platform that offers data analysis and visualization solutions. With its user-friendly interface, it allows users to easily navigate and manipulate complex data, making it the perfect tool for anyone looking to make sense of their information.
Features
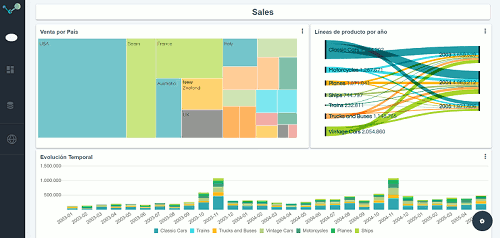
Key features of EDA include its powerful analytical tools that can handle large volumes of data. It provides high-speed processing, ensuring efficient and timely analysis. In addition, its visualization capabilities are top-notch, allowing users to create interactive charts and graphs that accurately represent their findings. This way, they can understand trends and patterns within their data more easily.
Another standout feature of EDA is its compatibility with various data formats. Whether you're working with CSV files or intricate SQL databases, EDA has got you covered. What's more, it integrates seamlessly with other platforms and systems, making it a versatile choice for different users. With EDA's advanced features and straightforward design, achieving meaningful insights from your data has never been easier.
