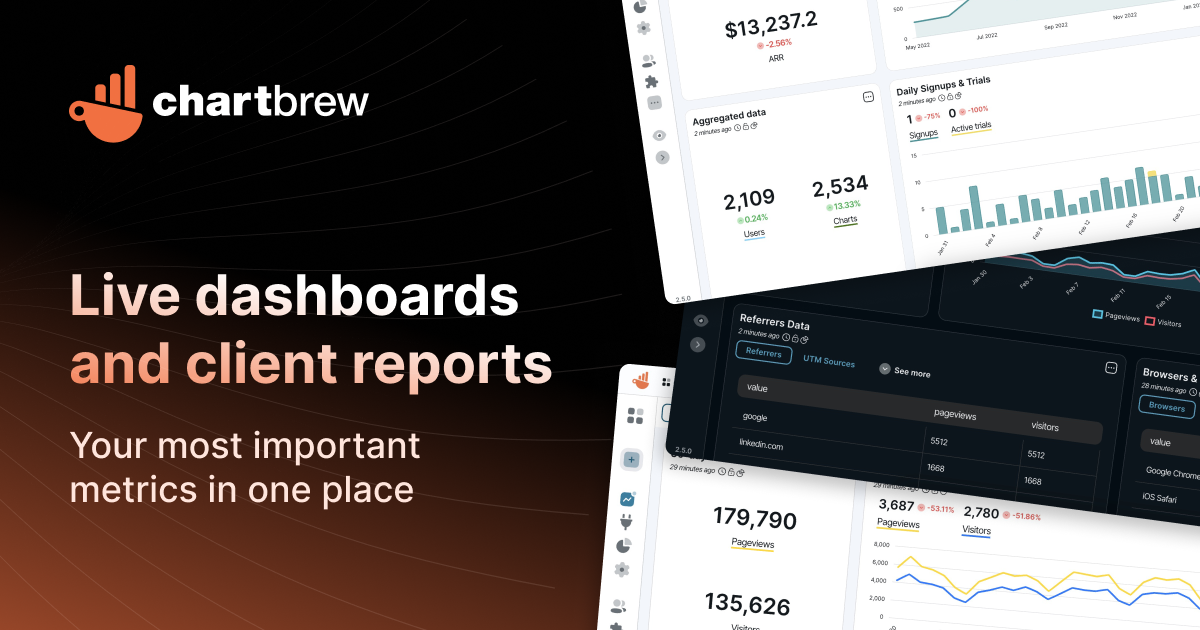
Chartbrew is an innovative, web-based application that provides a seamless connection to your databases and APIs. It serves as a powerful tool for extracting valuable data and transforming it into visually compelling charts. With its easy-to-use interface, Chartbrew makes data visualization a breeze, whether you're dealing with small datasets or large, complex ones.

Features
Key features of Chartbrew include its ability to interface directly with both databases and APIs. This flexibility allows users to gather data from various sources without needing additional software. Additionally, the application offers an intuitive chart creation process. Users can customize their charts according to their preferences, including different colours, sizes, and chart types.
Another noteworthy feature of Chartbrew is its strong focus on user-friendly design. The application is designed for both novice and expert users alike, providing straightforward navigation and operation. Users are guided through each step of the process, from connecting to their database or API, selecting relevant data fields, right through to finalizing their customized chart design.
In conclusion, Chartbrew shines as a versatile tool for generating insightful, visually pleasing graphs and charts from any database or API source. Its blend of simplicity and power makes it an essential tool for those seeking effective ways to visualize their data.
